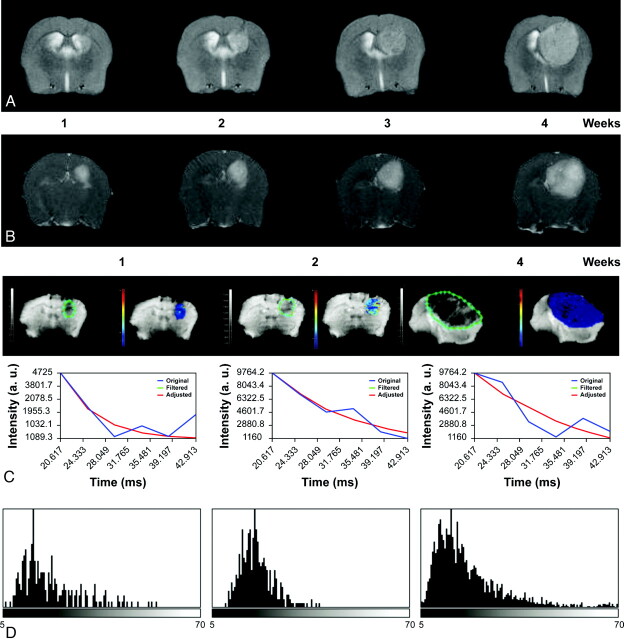
Fig 3.
Serial axial T2-weighted (A) and contrast-enhanced T1-weighted (B) images of a Gl261 C57/Bl6 mouse model of HGG, showing tumor growth and increased enhancement over a period of 4 weeks. C, ROIs delineating the tumor (green limit) 1, 2, and 4 weeks after implantation; and nonlinear fitting (red) of signal intensity versus TE (blue) in representative pixel and parametric T2* maps depicting T2* values in the selected ROI. D, T2* histograms nicely depict the temporal variation of T2* values with tumor progression modified by small differences in oxygen blood saturation reflected by the paramagnetic effect of deoxyhemoglobin.

