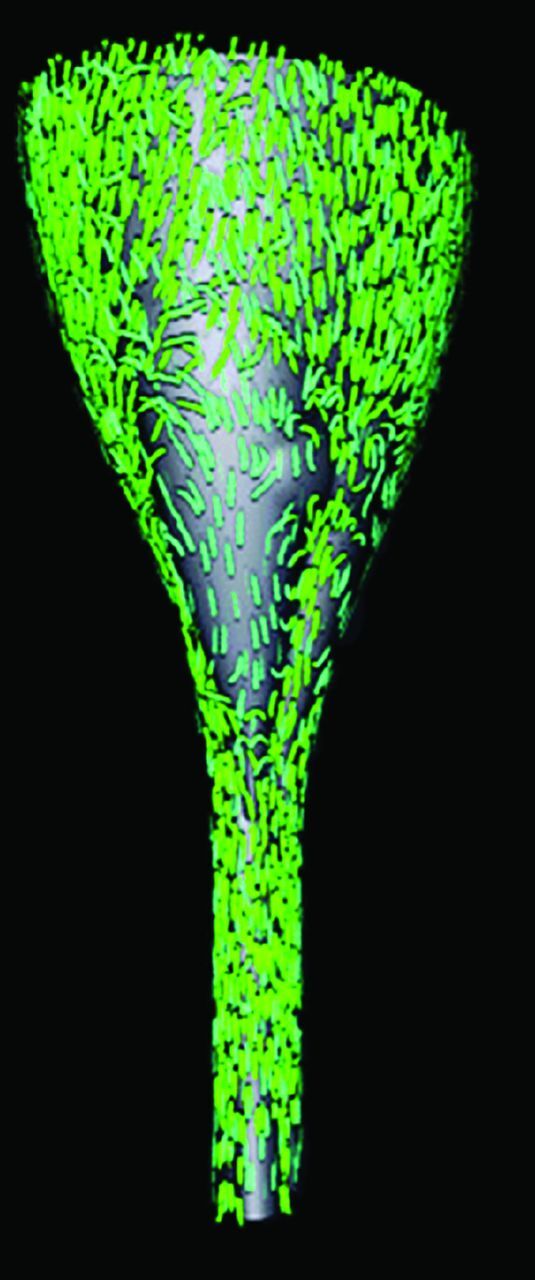
Fig 2.

A 3D representation of CSF velocities in an idealized model of the posterior fossa and spinal canal of a patient with Chiari I. It displays the subarachnoid space posteriorly. It shows the direction and magnitude of flow throughout the space at one moment in the cardiac cycle by the direction and length of arrows. Flow velocities and flow directions vary from one region to another. The flow is more rapid at the cervical spine below the tonsils than at the craniovertebral junction. Flow predominates in the long axis of the model but has evidence of vortices in some areas.
