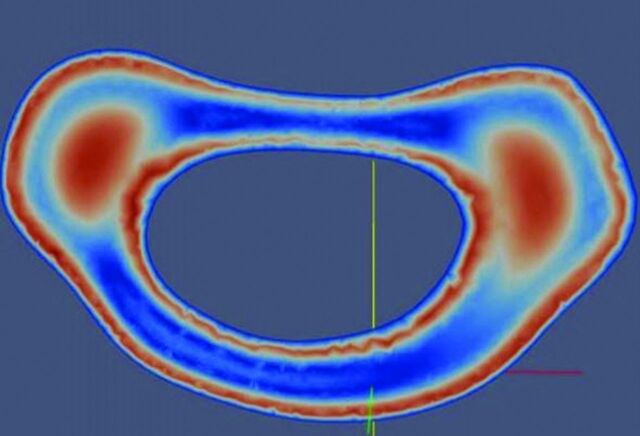
Fig 7.
Graphic illustrating simulated flow in a patient-specific model of the subarachnoid space to illustrate the inhomogeneity of CSF flow. Flow velocity, in red-blue-green color coding, shows the greatest velocities anterolateral to the spinal cord. Modified from Rutkowska et al.9

