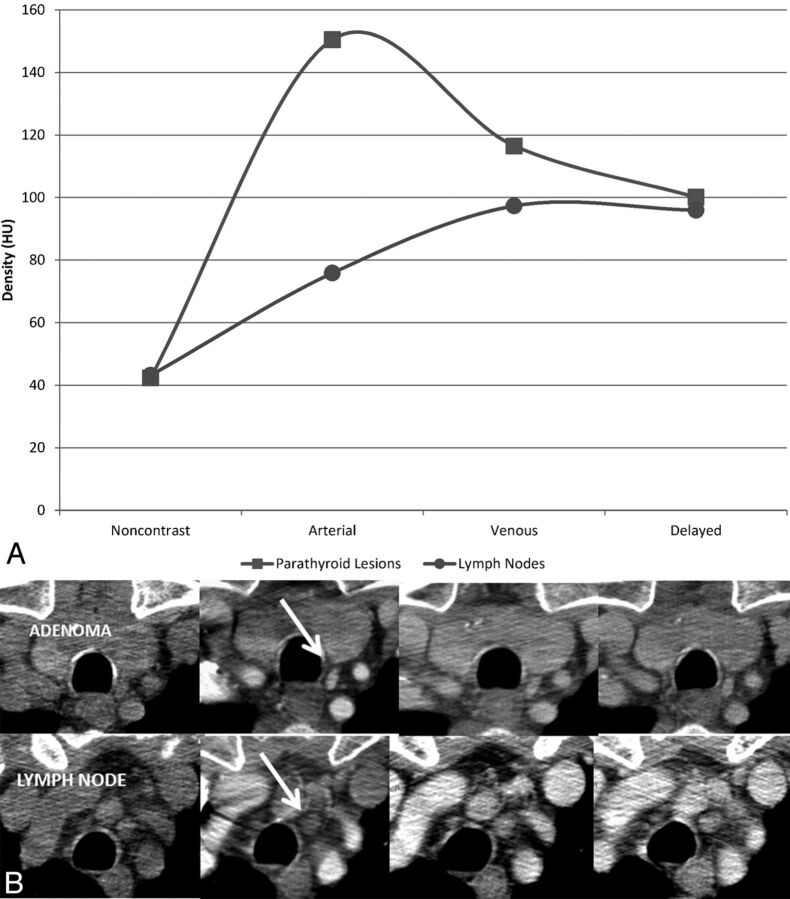
Fig 2.
Comparison of the attenuation of true-positive parathyroid lesions and lymph nodes across the 4 phases of contrast. A, The time-attenuation curve illustrates that the greatest difference in attenuation between a parathyroid adenoma and a lymph node is in the arterial phase. In the example in B, showing axial unenhanced, arterial, venous, and delayed phase CT images from left to right, note that the parathyroid adenoma enhances intensely in the arterial phase, while the lymph node does not (arrow). The 2 demonstrate similar densities in the venous and delayed phases.

