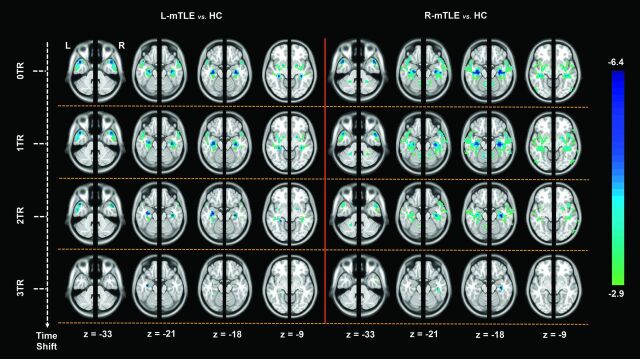
Fig 2.
Group comparisons of ts-VMHC maps between the patients and healthy controls. The left and right hemispheric ts-VMHC maps (0 TR, 1 TR, 2 TR, and 3 TR) of each patient group were compared with those of the HC by using 2-sample t tests (P < .05, AlphaSim corrected) under ANOVA. For a better visualization, we combined the comparison results of the left and right hemispheric ts-VMHC maps with a whole-brain map. The mesial temporal structures, limbic/paralimblic areas, and striatum areas show time-shift-dependent VMHC decreases.

