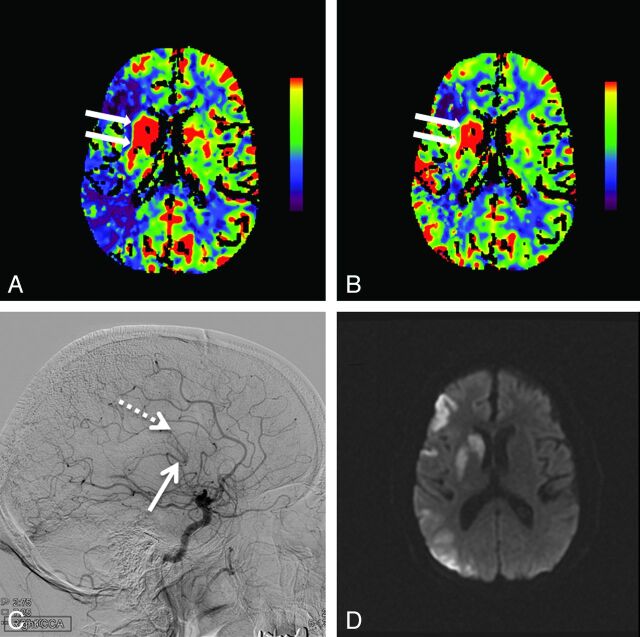
Fig 1.
Hyperperfusion in the right basal ganglia is demonstrated by increased cerebral blood flow (arrows, A) and increased cerebral blood volume (arrows, B). Also seen is a large region of right middle cerebral artery territory ischemia as evidenced by reduced CBF (A) with relative preservation of CBV (B). Lateral digital subtraction angiogram from a right carotid artery injection demonstrates early opacification of the basal vein of Rosenthal (solid arrow, C) and the internal cerebral vein (dashed arrow, C). Follow-up MR imaging 12 hours later shows restricted diffusion indicating infarction of the right basal ganglia, along with patchy cortical infarctions in the right MCA territory (D).

