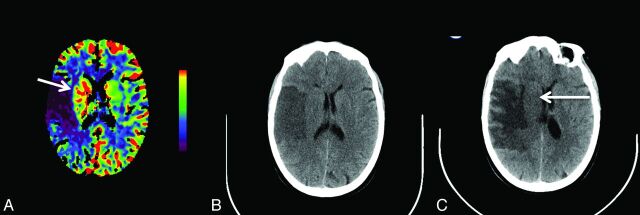
Fig 3.
Increased cerebral blood flow in the right basal ganglia (arrow, A) in addition to a large region of reduced CBF in the right middle cerebral artery territory is shown on the CT perfusion scan at presentation. Noncontrast head CT 1 day later demonstrates right MCA infarction but apparent sparing of the right basal ganglia (B). Follow-up CT at day 6 shows hypoattenuation involving right basal ganglia (arrow, C) in addition to evolution of a large right MCA infarction with mass effect.

