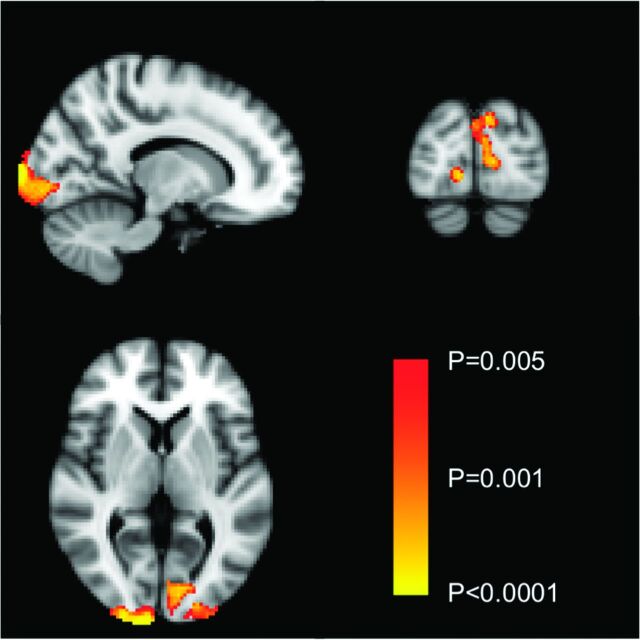
Fig 1.
Voxel-based morphometric analysis of differences in brain gray matter attenuation between the MoMHR and THA groups before exclusion of patients with primary ocular pathology. Comparative areas of gray matter loss in the MoMHR group are highlighted by using the color bar across the significance value range P < .05 to P < .001 (uncorrected).

