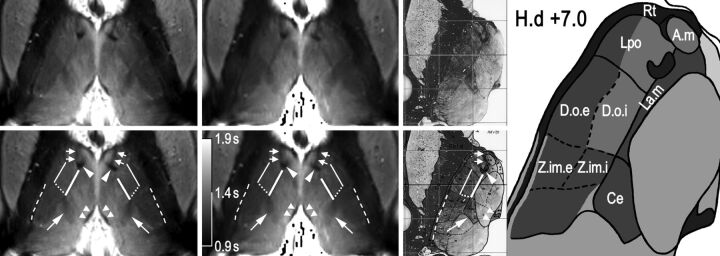
Fig 1.
Display of MR and brain atlas images. An IR-TSE MR image (left column) and a T1 map (middle column) of the thalamus of a healthy subject and the corresponding axial section from the Schaltenbrand and Wahren atlas for Stereotaxy of the Human Brain,21 including an illustrative sketch (right columns, plate LXXVIII H.d +7.0). Reproduced with permission from Thieme Medical Publishers. To facilitate comparison, the images are scaled so that thalami exhibit comparable sizes in the anteroposterior direction. The MR images were acquired with a resolution of 0.52 × 3 mm3 (left column) and 0.62 × 3 mm3 (middle column). In the bottom row, which is identical to the top row, note the following structures: Bold lines mark the lamella medialis (La.m), thin lines mark the border between the internal and external part of the nucleus dorso-oralis (D.o.i and D.o.e), dotted lines show the border between the internal parts of the nuclei dorso-oralis (D.o.i) and zentrolateralis intermedius (Z.im.i), dashed lines indicate the posterior part of external medullary lamina, arrows point to the centre médian (Ce), arrowheads indicate the mamillothalamic tract, paired arrowheads indicate the stria medullaris, and pairs of arrows indicate a myelinic sheet separating the nuclei lateropolaris (Lpo) and anteromedialis (A.m). Note the very similar contrast in the IR-TSE image (TI = 500 ms) and the T1 map.

