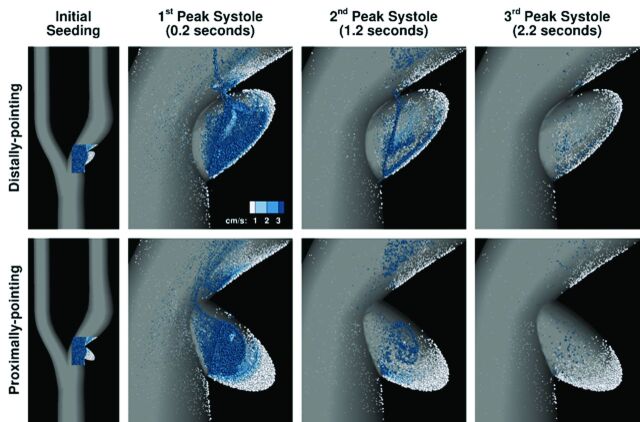
Fig 4.
Visualization of flow patterns computed in a 30%-stenosed carotid bifurcation with distally and proximally pointing ellipsoidal ulcers. The leftmost column shows the full CFD models and the initial distribution of particles seeded at end diastole. Subsequent columns show the distribution of particles remaining after each peak systole, with the amount of time since seeding (ie, residence time) also indicated. Colors are used to indicate particle velocity in cm/s, and size indicates the depth of the particles such that large particles are those closest to the symmetry plane and small particle are those closest to the walls.

