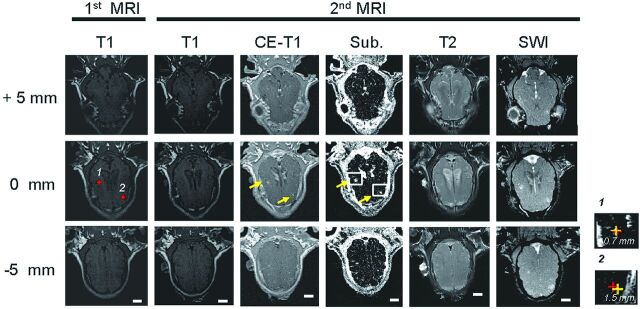
Fig 1.
Typical MR image sets (0.43-MPa pressure). Column 1: T1-weighted images obtained in the first MR imaging scan (before FUS exposure, for neuronavigation guidance). Columns 2–4: T1, CE-T1, and subtracted T1-weighted images obtained in the second MR imaging scan (after FUS exposure, for treatment validation). Column 5: T2-weighted images. Column 6: Susceptibility-weighted images. Zoomed regions (right) demonstrate the measured discrepancy between the targeted and maximum SI increase locations at targets 1 and 2 (0.7 and 1.5 mm, respectively).

