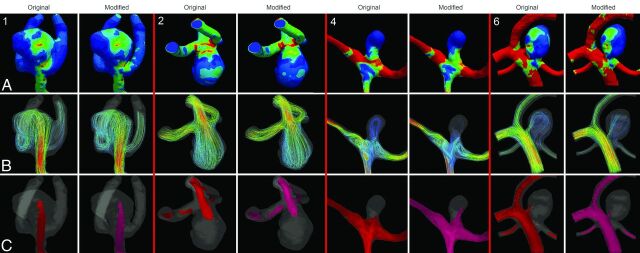
Fig 4.
Hemodynamic features in original (left) and modified vascular models (right). Case 1 shows a similar impingement zone and WSS distribution, flow velocity, and direction of the inflow jet. Case 2 shows an increase in maximal WSS, unchanged flow velocity, and direction of the inflow jet. Case 4 shows an increased maximal WSS, an increased impingement zone, an increased maximal flow velocity, and a change in inflow jet position. Case 6 shows a decrease in maximal WSS, a change in impingement zone, and a change in the maximal flow velocity and the position of the inflow jet.

