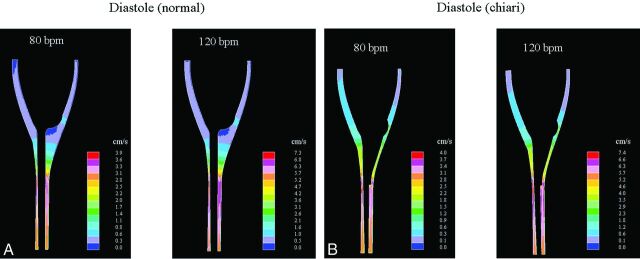
Fig 3.
CSF flow velocity in a midsagittal plane in the normal and the Chiari models at the time of peak diastolic flow (positive direction). Flow cycling at 80 cpm is shown to the left, and 120 cpm, to the right. Maximal velocities occur below the tonsils in the Chiari model and in a similar location in the normal model.

