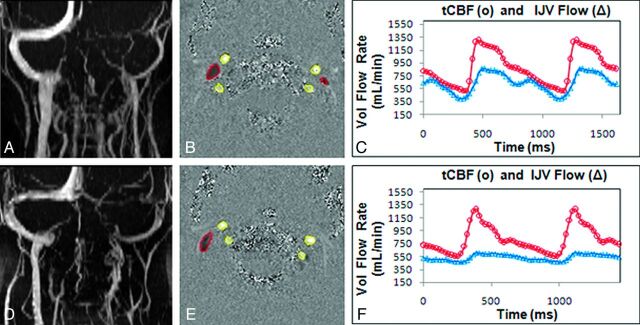
Fig 2.
Extracranial MRV, arterial inflow, and venous outflow measurements through the IJVs. An example of MRV (A, D) showing extracranial venous drainage; velocity-encoded phase-contrast images (B, E) showing segmentation of the arterial (bright pixels with yellow outline) and venous (dark pixels with red outline) lumens; and derived volumetric flow rate waveforms (C, F) for total CBF (red) and IJV outflow (blue). Data shown are from a representative control subject (top row) and a patient with IIH (bottom row). Volumetric IJV outflow is lower in the patient with IIH compared with the control subject.

