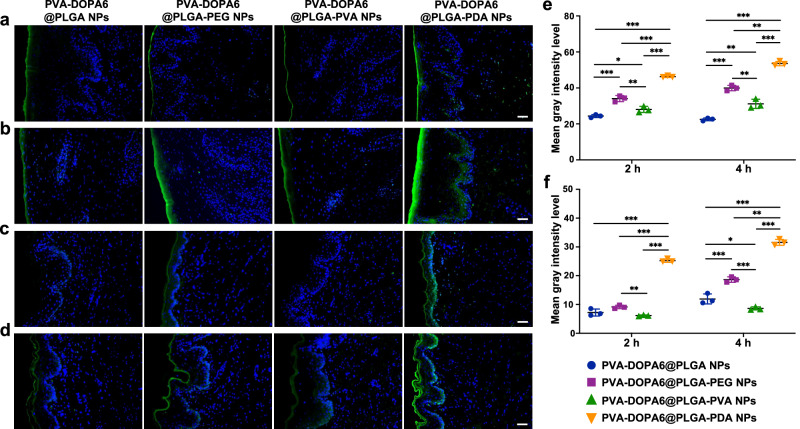
Fig. 6. Ex vivo and in vivo permeation studies.
a, b Ex vivo distribution of different NPs in porcine buccal tissue incubated for 2 h and 4 h, respectively. Scale bars: 100 μm. PVA: poly(vinyl alcohol), DOPA: 3,4-dihydroxy-D-phenylalanine, PLGA: poly(lactic-co-glycolic acid), PEG: poly(ethylene glycol), PVA: poly(vinyl alcohol), PDA: polydopamine. c, d In vivo distribution of different NPs in rat buccal tissue incubated for 2 h and 4 h, respectively. Scale bars: 100 μm. e Quantification of the fluorescence intensity of different NPs obtained from fluorescence images of porcine buccal tissue. *P = 0.031; **P < 0.01; ***P < 0.001. f Quantification of the fluorescence intensity of different NPs obtained from fluorescence images of rat buccal tissue. *P = 0.033; **P = 0.005; ***P < 0.001. All data are Mean ± S.D. n = 3 animals per group. Statistics was calculated by one-way ANOVA followed by Tukey’s post-test. Exact P values are given in the Source Data file. Source data are provided as a Source data file.

