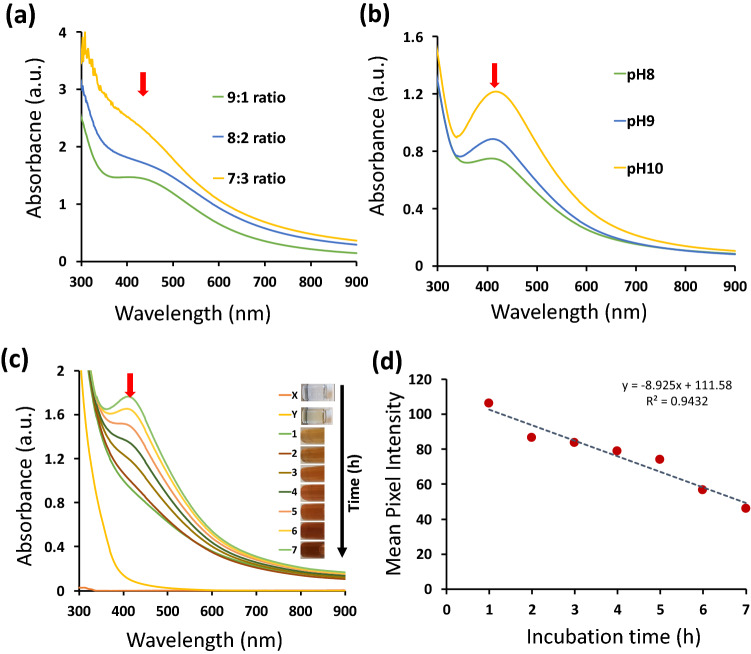
Figure 1.
UV–Vis spectrum (black arrows shows peak absorbance at 420 nm in the spectrum). The ratio of solution X to Y was optimized as indicated in (a) where the 9:1 shows the higher absorbance. The effect of pH on SpNPs synthesis was also observed and shown in (b), the rise in pH indicated better synthesis. Detailed time-based synthesis of solution Z is shown in (c) which confirmed the formation of SpNPs after 3 h. No absorbance is resulted for solution X and Y as shown by UV–Vis spectrum in (c), Mean pixel intensity (MPI) plot (d). The change in color vs. incubation time has shown for solution Z. The decrease in MPI revealed the increase of color darkness.

