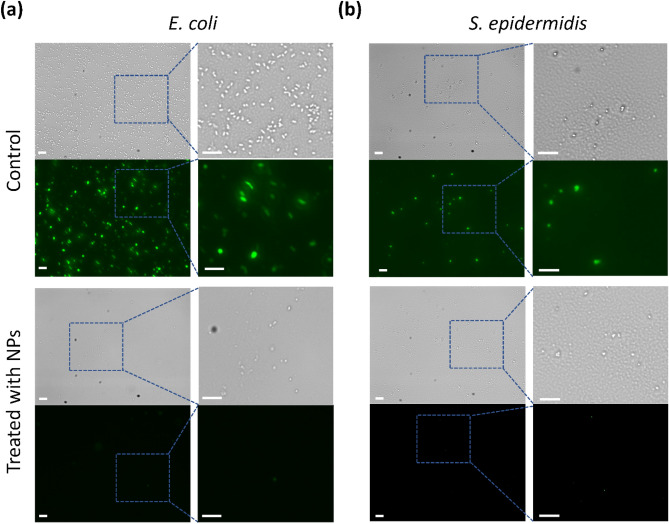
Figure 5.
Microbial cell viability. E. coli (a) and S. epidermidis (b) were observed using green, fluorescent nuclear stain, Syto 16. The comparative analysis is shown between bacterial cells with (treated with SpNPs) and without the treatment of SpNPs (control). The treated cells exhibited negligible fluorescence as compared to the untreated microbial cells. Bright field and fluorescent images are shown on up and down positions, respectively. Selected areas are zoomed-in for better microbial cell visualization. The scale bar is 10 µm for all images.

