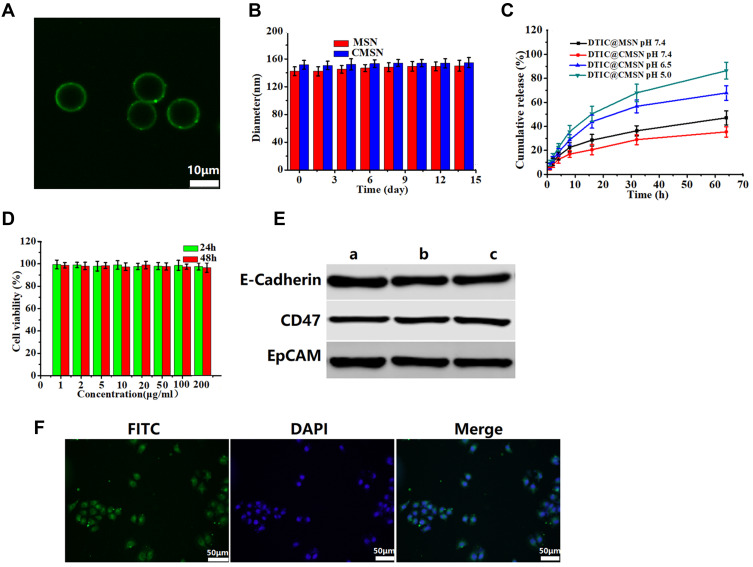
Figure 1.
(A) Evidence for the coverage of cancer cell membranes coated on the surface of mesoporous silica nanoparticle by confocal microscopy. Scale bar represents 10 μm. (B) Stability of MSN and CMSN in PBS over time. (C) In vitro release profiles of DTIC from DTIC@MSN (pH 7.4) and DTIC@CMSN in PBS (at pH 7.4, pH 6.5 and pH 5.0). (D) Cell viability of B16F10 cells incubated with CMSN without drug at various concentrations measured at 24 h and 48 h. (E) The analysis of E-Cadherin, CD47 and EpCAM by Western blot. a: cancer cell lysate; b: cancer cell membranes; c: CMSN. (F) Confocal laser scanning microscopy images of B16F10 cell by cultured with FITC (green) labeled CMSN and DAPI (blue) used for staining cell nuclei. Scale bar is 50 μm.

