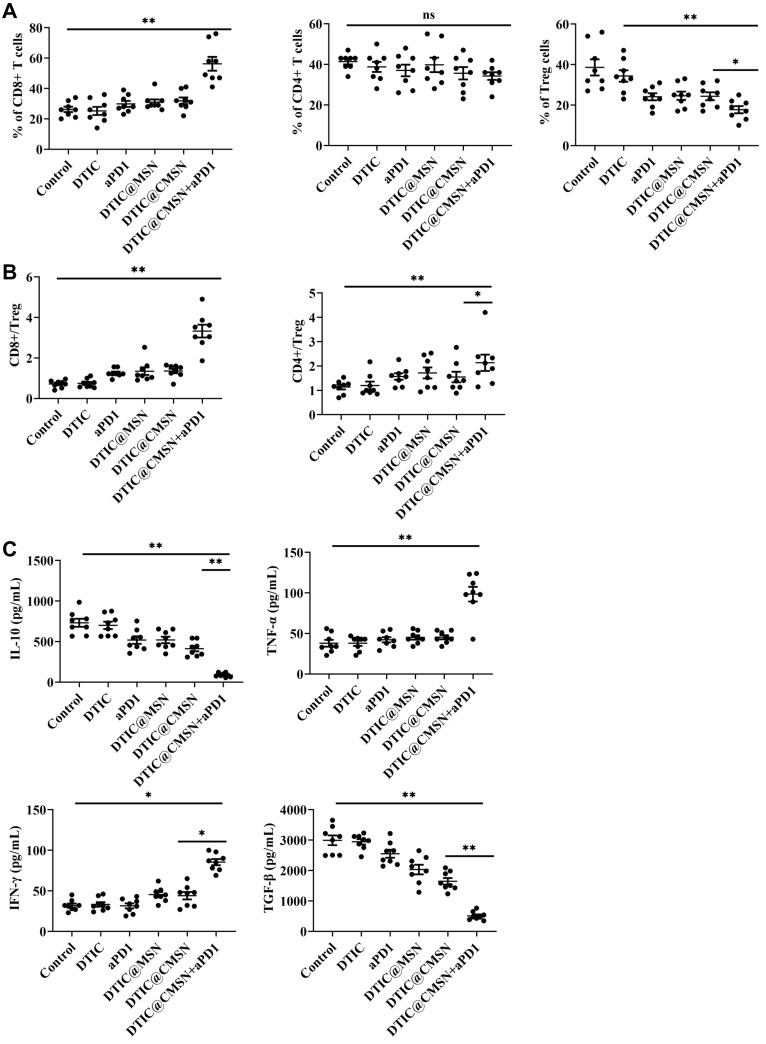
Figure 5.
(A) Fractions of tumor-infiltrating CD4+, CD8+ and CD4+ FoxP3+ regulatory T cells (Treg cells) in the tumors with different treatments by flow cytometry. (B) CD8+ CTL-to-Treg ratios and CD4+ effecter T cells-to-Treg ratios in the tumors with different treatments. (C) Enzyme-linked immunosorbent assay (ELISA) analysis of IL-10, TNF-α, TGF-β and IFN-γ after the mice were injected with PBS, DTIC, aPD1, DTIC@MSN, DTIC@CMSN and DTIC@CMSN+aPD1. *P < 0.05, **P < 0.01.

