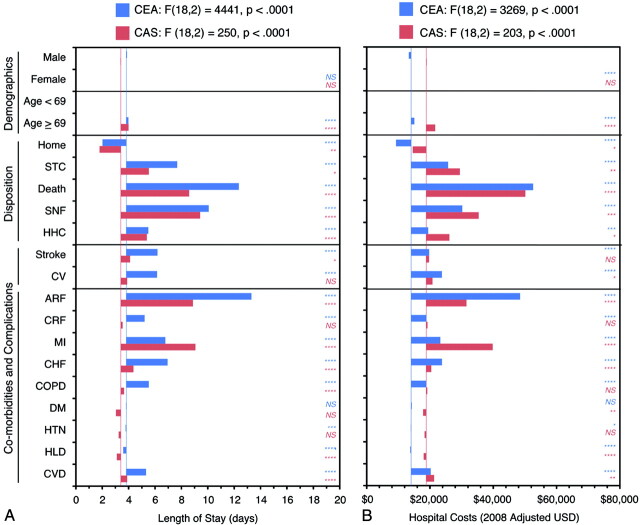
Fig 3.
Predictors of length of stay and hospital costs for CEA and CAS by using multivariate regression analysis. Regression estimates for demographic and treatment variables for CEA (blue) and CAS (red) are shown for LOS (A) and 2008-adjusted hospital costs (B). The unadjusted response variable for each model, representing the baseline model value, is represented by the vertical colored lines (CEA, blue; CAS, red). Variable adjustments are shown by positive or negative bar-graph deflections from this baseline value. Regression results for each model are shown. Significance for each variable is coded as follows: ****P < .0001; ***P < .001; **P < .01; *P < .05; NS P ≥ .05).

