
Fig 3.
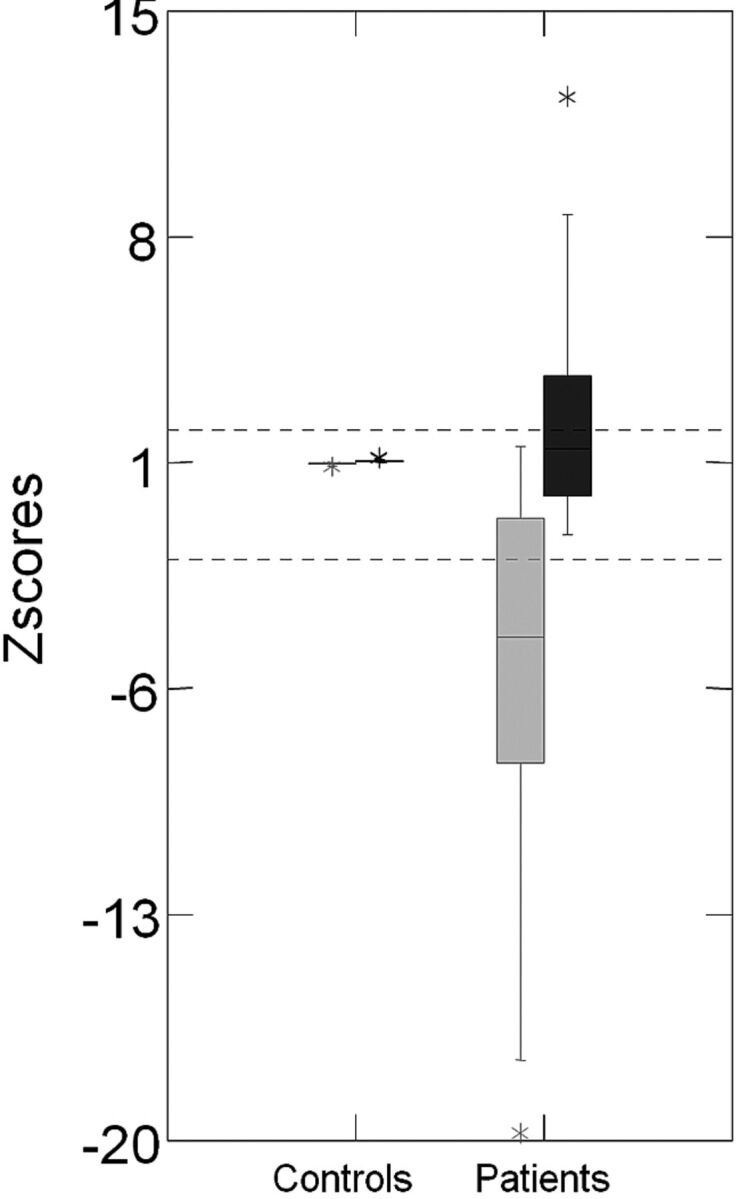
Z score distribution of the hippocampal asymmetry index for volumetry and T2 relaxometry analyses. On the left side is the boxplot graphic of z scores of the volumetry asymmetry index (gray) and T2 relaxometry asymmetry index (black) of controls. On the right side is the boxplot graphic of z scores of the volumetry asymmetry index (gray) and T2 relaxometry asymmetry index (black) of patients with MTLE.