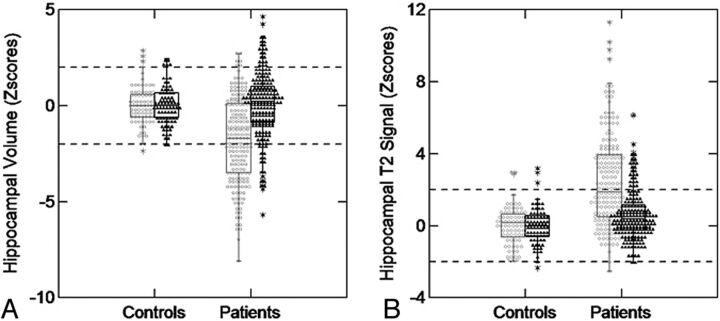
Fig 4.
Z score distribution of hippocampal volumes and T2 signal in patients with MTLE and controls. A, Boxplot graphic shows z scores of hippocampal volumetry for controls and patients with MTLE. On the left side of the graphic are shown the hippocampal volumes of controls (white circles = right hippocampi; mean volume, 4.28 ± 0.35 cm3; black triangles = left hippocampi; mean volume, 4.21 ± 0.32 cm3). On the right side of the graphic are shown the hippocampal volumes of patients (white circles = hippocampi ipsilateral to the epileptic focus; mean volume, 3.78 ± 0.51 cm3; black triangles = hippocampi contralateral to the epileptic focus; mean volume, 4.28 3± 0.56 cm). B, Boxplot graphic shows z scores of hippocampal T2 relaxometry for controls and patients with MTLE. On the left side of the graphic is the hippocampal T2 signal of controls (white circles = right hippocampi; mean signal, 96.77 ± 4.05; black triangles = left hippocampi; mean signal, 96.98 ± 4.10). On the right side of the graphic is the hippocampal T2 signal of patients (white circles = hippocampi ipsilateral to the epileptic focus; mean signal, 105.49 ± 7.88; black triangles = hippocampi contralateral to the epileptic focus; mean signal, 99.10 ± 5.01).

