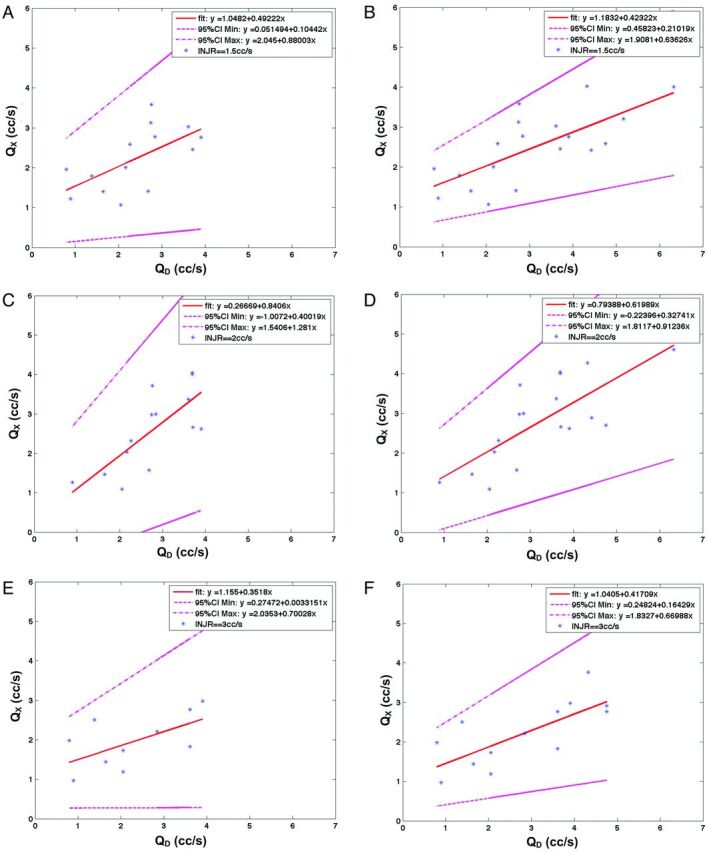
Fig 2.

A and B, The regression fit at QI = 1.5 mL/s for QD ≤ 4 mL/s (left) and QD ≤ 7 mL/s (right). QX is represented on the y-axis, and QD, on the x-axis. The data (blue star points), fit (red line), and 95% CI limits (magenta) are all represented. C and D, The regression fit at Qi = 2.0 mL/s for QD ≤ 3 mL/s (left) and QD ≤ 7 mL/s (right). QX is represented on the y-axis and QD on the x-axis. The data (blue star points), fit (red line), and 95% CI limits (magenta) are all represented. E and F, The regression fit at Qi = 3.0 mL/s for QD ≤ 3 mL/s (left) and QD ≤ 7 mL/s (right). QX is represented on the y-axis, and QD, on the x-axis. The data (blue star points), fit (red line), and 95% CI limits (magenta) are all represented.
