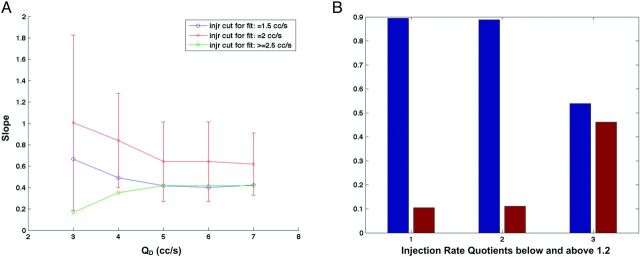
Fig 4.
A, Slope versus QD for injection rates Qi = 1.5 (blue), 2.0 (red), and 3.0 mL/s (green). The 95% CI limits have been superimposed to Qi = 2.0 mL/s points. The graph shows that the slope bias calculated is not significantly different from 1 up to QD = 6 mL/s (P > .05). The Qi = 1.5 mL/s group (blue points) follows the same evolution trend as Qi = 2.0 mL/s, though with accentuated bias. A nonsignificant slope bias is likely for the QD range below 3 mL/s (P = .06). B, Injection rate quotients for Qi = 1.5 mL/s (group 1), 2.0 (group 2), and 3.0 mL/s (group 3). The blue bars correspond to quotients <1.2, and the red bars, to quotients >1.2. The fact that the Qi = 1.5 and 2.0 mL/s groups are reconstructed in similar ways with minimum slope bias, unlike the Qi = 3.0 mL/s group, is partly due to differences in injection rate quotients (P = .01).

