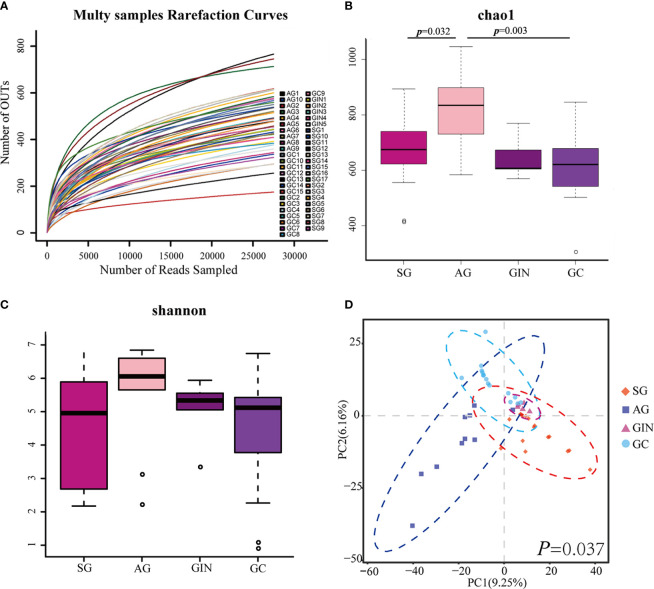
Figure 1.
The microbial α diversity and β diversity analysis in different groups. (A) Rarefaction curves for operational taxonomic units (OTUs). (B) Chao 1 index was higher in atrophic gastritis (AG) compared with superficial gastritis (SG) and gastric cancer (GC) and (C) there was no significant difference in Shannon index among the four groups (Student’s t-test was used to compare each two groups). (D) Partial least squares Discriminant Analysis revealed different microbial community structures in the four groups (ANOSIM was used to evaluate the similarity among groups).

