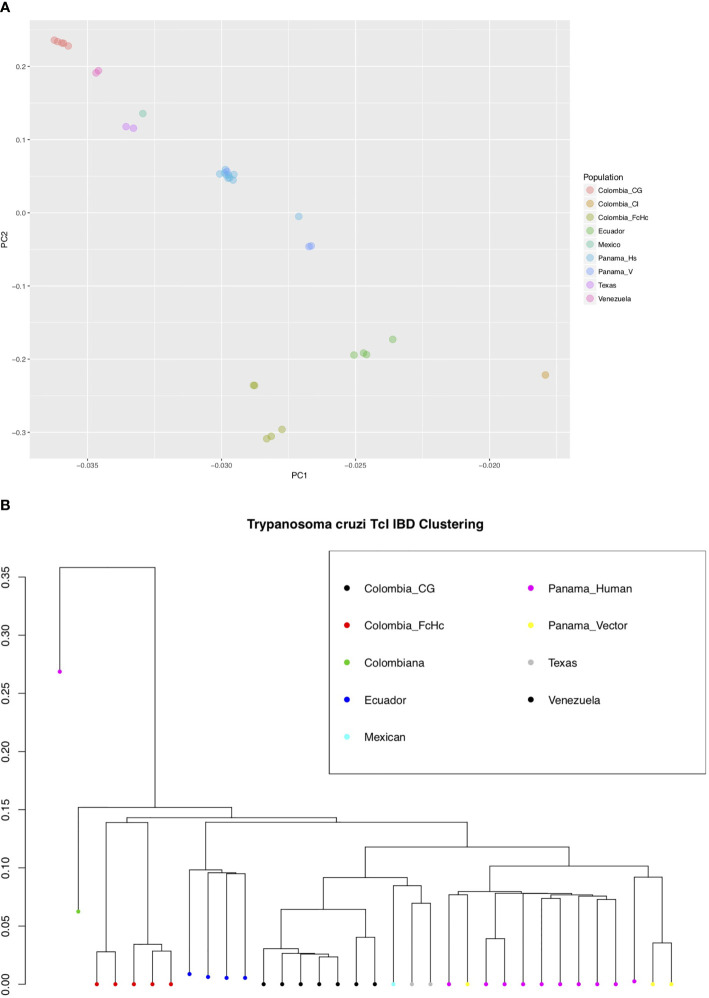
Figure 2.
(A) Bayesian principal component analysis (PCA) of T. cruzi TcI strains using INDELs. The percentage of variance for PC1 was 46.2 and for PC2 28.6. (B) Identity by Descent (IBD) dendogram of T. cruzi TcI strains using SNPs, calculated using 1000 bootstraps. Both analyses, using different markers, support the population structure of the analyzed TcI samples. Notably, the highly virulent TcI Colombiana and the Panamanian TcI H1 from a chronic patient are presented as outliers [(B), far left].

