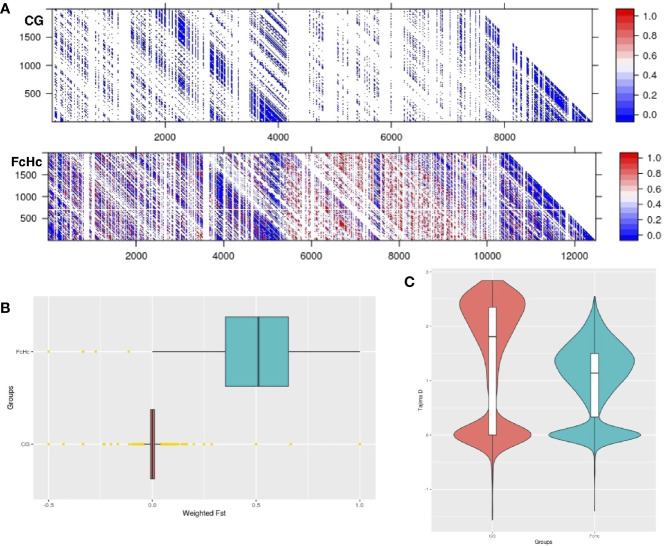
Figure 3.
(A) Linkage disequilibrium matrix (r2) of chromosome 2 for the Colombian CG and FcHc clones. LD values range from 0 (recombination) to 1 (no recombination). (B) Genome-wide Fst distribution in 10 Kb bins displaying a state of panmixia for the CG clones and moderate genetic differentiation in the FcHc clones, yellow dots represent outlier bins. The differences in chromosome length are caused by missing sequences in these strains, that resulted in regions with no mapping that were removed from the analysis. (C) Distribution of subtelomeric Tajima’s D selection test in both groups displaying overall balancing selection (D > 0) in these regions for both clones.

