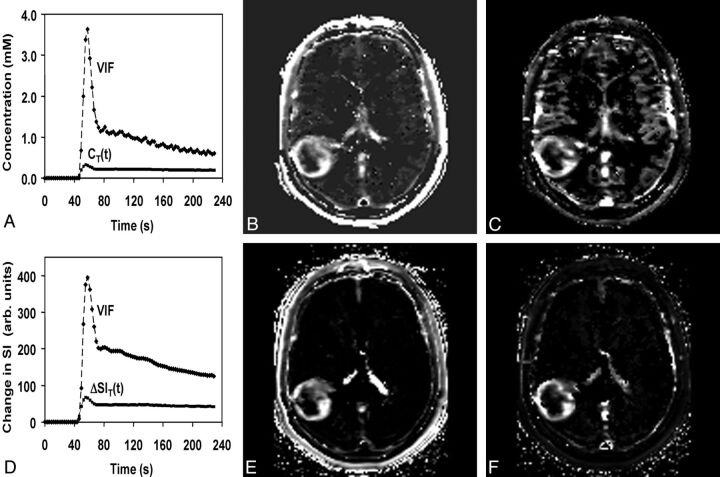
Fig 1.
A, Phase-derived VIF and tumor CT(t) from a patient with confirmed grade IV glioma obtained at 3T. B and C, Ktrans_ϕ (B) and Vp_ϕ (C) maps. D, Magnitude-derived VIF and tumor signal-intensity changes from the same patient for comparison. E and F, Ktrans_SI (E) and Vp_SI (F) maps. Maximal Ktrans_ϕ and Vp_ϕ values in tumor are 0.099 minutes−1 and 5.7 mL/100 g compared with 0.15 minutes−1 and 18 mL/100 g for Ktrans_SI and Vp_SI.

