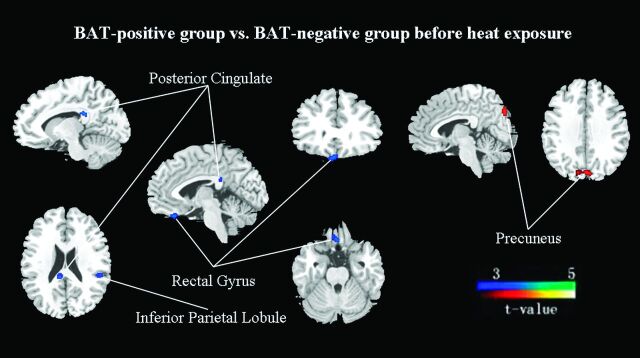
Fig 1.
Group differences in regional cerebral activity before heat exposure (FDR correction at P < .01). The figures are depicted in neurologic orientation. The gray-scale image is a T1 structural MR image that is representative of MNI space. Compared with control subjects, blue areas represent relatively hypometabolic regions and red areas represent relatively hypermetabolic regions in BAT-positive subjects.

