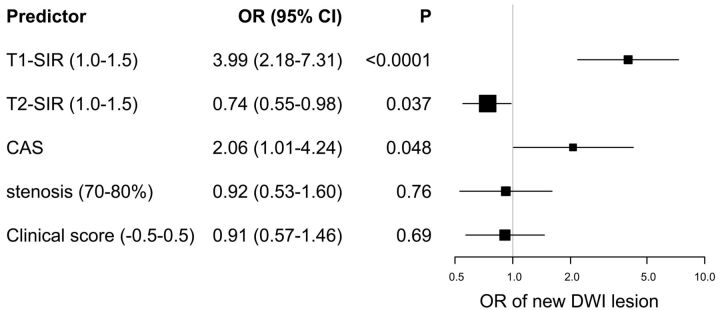
Fig 2.
Forest plot of ORs of the full penalized logistic regression model for new occurrences of hyperintense lesions on DWI after CEA or CAS. All odds of continuous variables (T1-SIR, T2-SIR, stenosis, and clinical score) are represented as odds per increase, described in parentheses. Squares and horizontal bars represent ORs and 95% CIs, respectively, on a log scale. The size of the squares represents precision.

