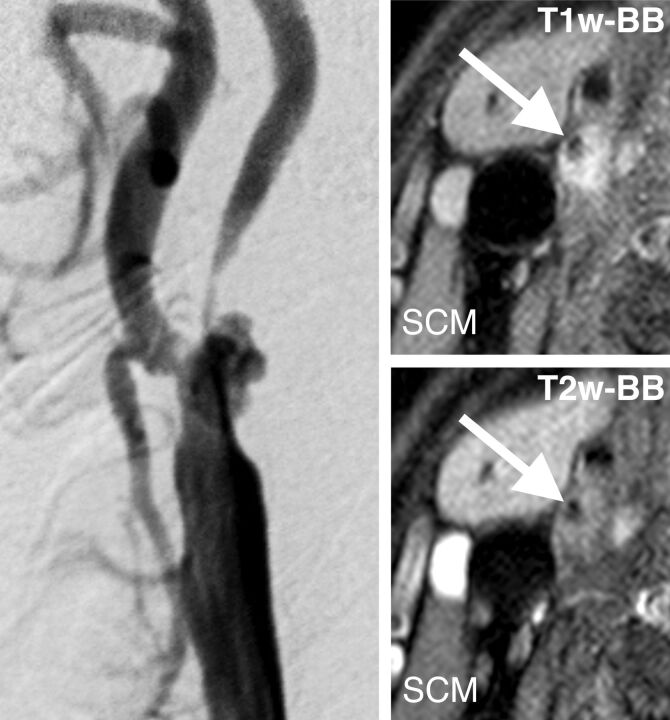
Fig 5.
An example using the preliminary nomogram for predicting the probability of new occurrences of hyperintense lesions on DWI after treatment (CEA or CAS). Left: right carotid angiogram. Right upper: T1WI-BB. Right lower: T2WI-BB. Arrows indicate the lumen of the ICA. See text and Table 2 for details.

