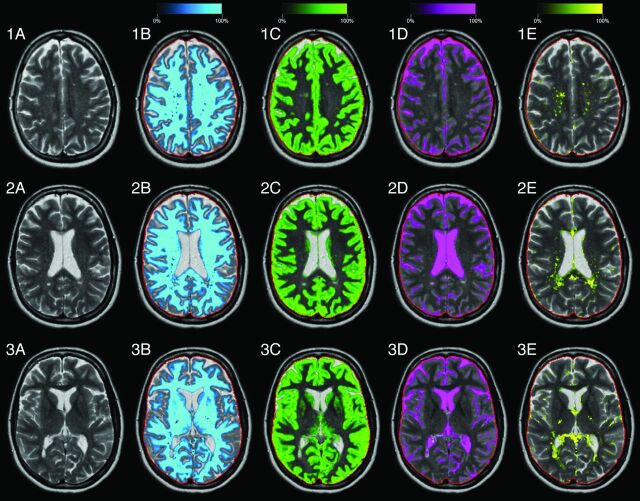
Fig 1.
Typical images of the automatic segmentation software of a patient with MS (39-year-old woman, EDSS = 4.0). Three slices are shown, numbers 19, 16, and 13 of the 30 acquired slices. A, T2-weighted image. B, White matter segmentation, in which the intensity of the light-blue color overlay corresponds to the calculated white matter partial volume per voxel. The red line indicates the intracranial volume. Similar images are shown for gray matter in green (C), CSF in pink (D), and non-WM/GM/CSF in yellow (E).

