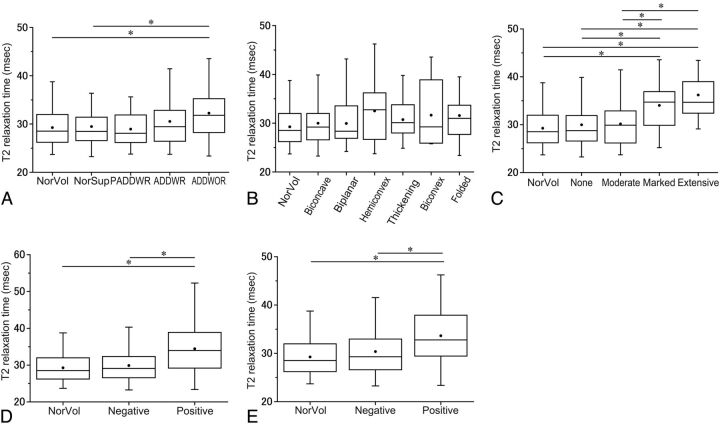
Fig 2.
The T2 relaxation times according to the MR image interpretations. A, The T2 relaxation times according to the articular disk position and function categories. The asterisk indicates P < .05/5 in the Mann-Whitney test with a Bonferroni correction. B, The T2 relaxation times according to the articular disk configuration categories. “Thickening” indicates thickening of the posterior band. C, The T2 relaxation times according to the joint effusion categories. “None” indicates no or minimal fluid; “Moderate,” moderate fluid; “Marked,” marked fluid; and “Extensive,” extensive fluid. The asterisk indicates P < .05/5 in the Mann-Whitney test with a Bonferroni correction. D, The T2 relaxation times according to the osteoarthritis categories. The asterisk indicates P < .05/3 in the Mann-Whitney test with a Bonferroni correction. E, The T2 relaxation times according to the bone marrow abnormality categories. The asterisk indicates P < .05/3 in the Mann-Whitney test with a Bonferroni correction. NorVol indicates healthy volunteers.

