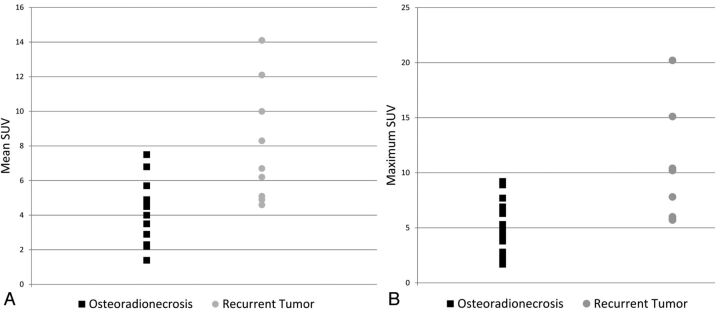
Fig 5.
Scatterplots for SUV measurements for patients with ORN and those with tumor recurrence. A, Scatterplot for SUVmean in patients with ORN and tumor recurrence demonstrates significant overlap between SUV values, despite a significant difference between their means. B, Scatterplot for SUVmax in patients with ORN and tumor recurrence also demonstrates significant overlap between maximum SUV values in the 2 groups.

