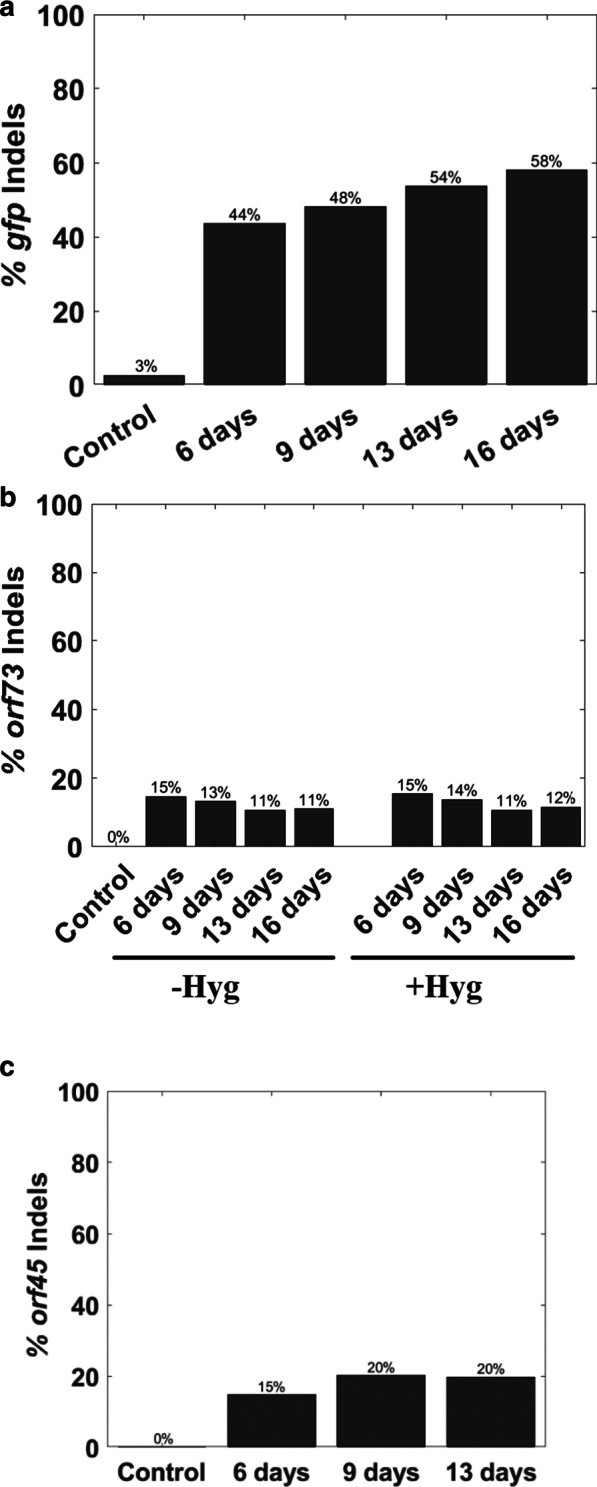
Fig. 5.

Sequencing the episome CRISPR-Cas9 cut sites. To map insertions and deletions (indels), we amplified genomic DNA and subjected it to deep sequencing. The percentage on the y axis represents the total number of reads with indels divided by the total numbers of reads. The identities of the samples are indicated on the x axis, including the name of the gene and the number of days post sgRNA transduction. Percentage of indels flanking the cutting site in gfp using the hygromycin minus sgGFP samples (a). Percentage of indels flanking the cutting site in orf73 using both hygromycin minus and hygromycin plus samples (b). Percentage of indels around the cutting site in orf45 using hygromycin minus samples (c)
