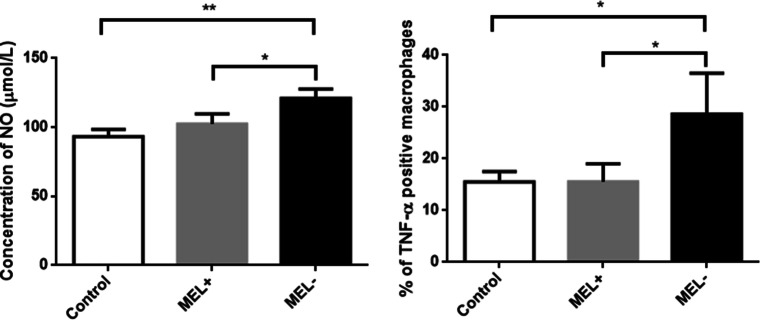
Fig. 11.
Left: Nitric oxide (NO) levels in the culture medium of macrophages infected by MEL+ and MEL− conidia. MEL− conidia induced higher levels of NO production than MEL+ conidia. Right: Percentage of TNF-α-positive macrophages in each group. MEL− strains could induce more TNF-α production by macrophage. *P < 0.05; **P < 0.01

