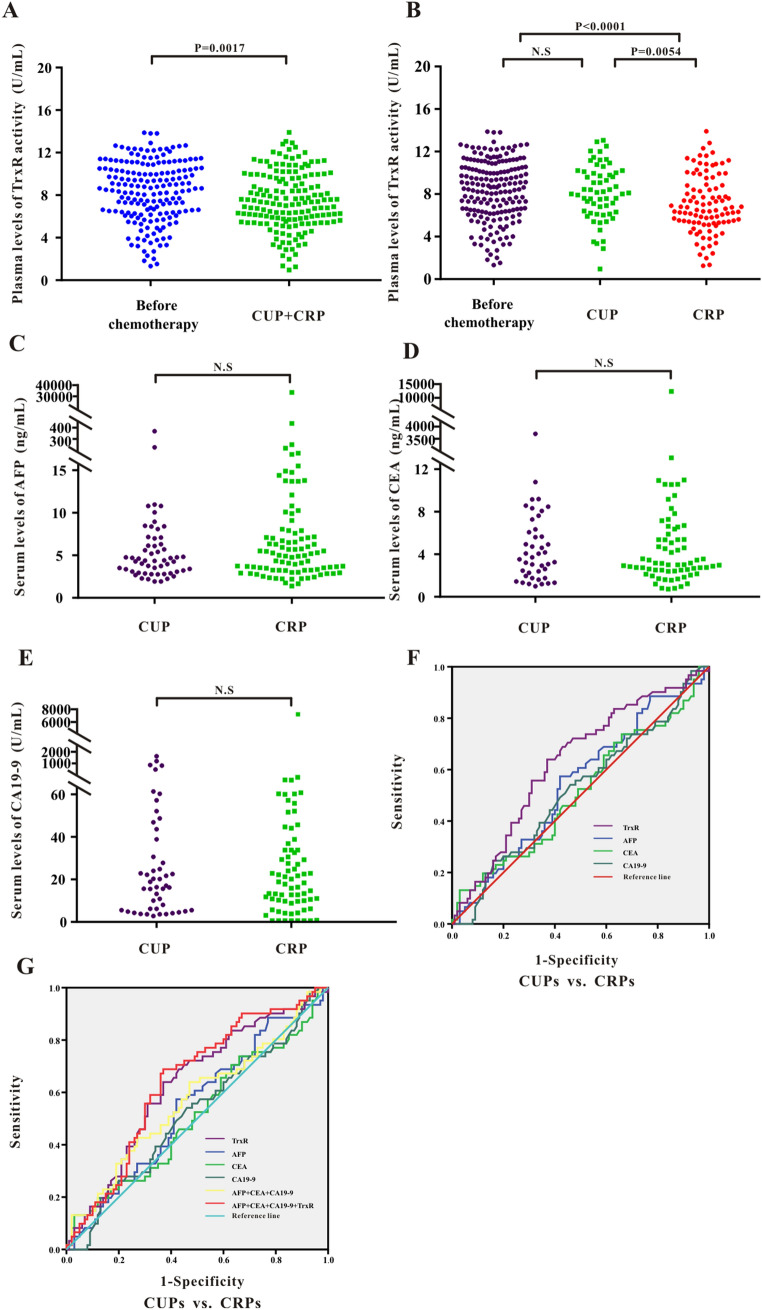
Figure 4.
(A) Scatter plot of the distribution of plasma TrxR activity levels between liver cancer patients before clinical interventions and MLC patients after chemotherapy. (B-E) Scatter plot of the distribution of plasma TrxR (B), serum AFP (C), CEA (D), and CA19-9 (E) among MLC patients with different clinical outcome after chemotherapy (CUP vs. CRP). CUP: clinical unresponsive patient; CRP: clinical responsive patients. P values were determined by the Mann–Whitney U test. N.S: no statistical significance. (F-G) ROC curve analyses of TrxR, AFP, CEA, CA19-9 (F), and the combinations (G) for the differentiation of MLCs with different clinical outcome after chemotherapy (CUP vs. CRP).

