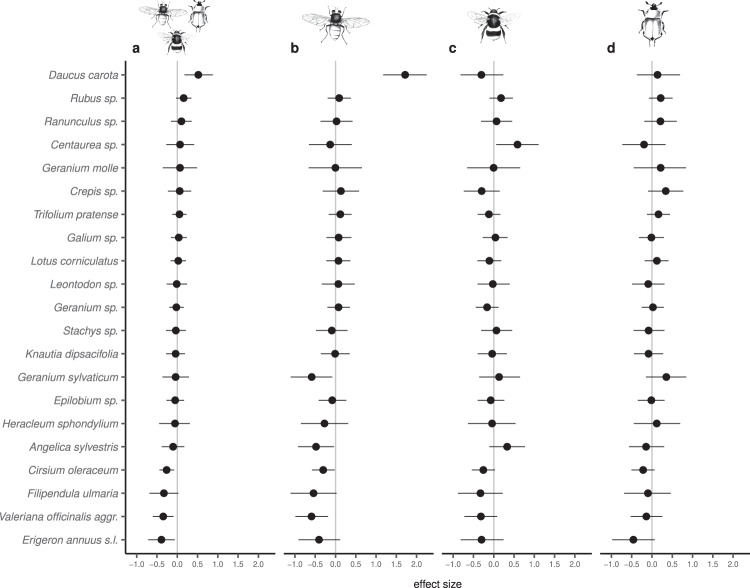
Fig. 1. Effect of artificial light at night on diurnal plant–pollinator interactions.
Plant-specific estimated effects (median ± 95% credible interval, computed from the marginal posterior distribution of the model parameters) of the light treatment on the total number of plant–pollinator interactions (a all insect groups together), and separate for the different insect groups (b Diptera, c Hymenoptera, d Coleoptera). As the response variable was log-transformed to fulfill the model assumptions (Gaussian error distribution), the back transformed number of interactions at lit sites equals to the number of interactions at unlit sites × exp(effect size). For example, an average of 10 interactions at unlit sites with an effect size of −1 translates in 10 × exp(−1) interactions at lit sites (i.e., 3.68 interactions).

