Figure 2.
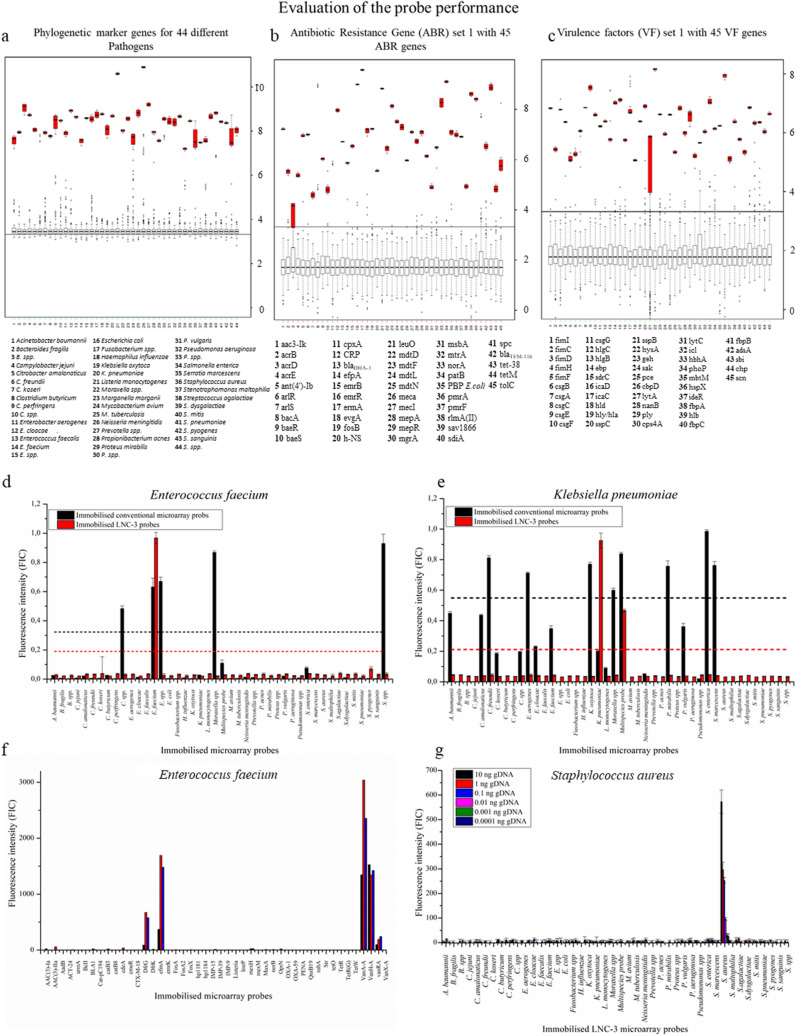
Performance of the LNC-3 probes: A set of 45 LNC-3-probes (and detection oligonucleotides) was tested in terms of specificity by applying complementary synthetic target DNA to the chip surface, the latter carrying all 45 specific parts of 16S rRNA genes serving as phylogenetic markers (a), ABR genes (b), and VF genes (c). All correct signals (red) were evaluated statistically against the signals of all non-matching probes (grey), using median-based z-scores (see Materials and Methods section for more detailed description). In the boxplots, all single values are located inside the boxes with associated error bars representing the standard deviation. The black bars represent the median values. The grey boxes summarise the values of the probes that did not match the gene fragment of interest, the red ones illustrate the positive signals. Statistical analyses and depiction were done with R: A Language and Environment for Statistical Computing65 Identification via conventional, hybridisation-based detection (black) and LNC-3 technology (red) of E. faecium (d) and Klebsiella pneumoniae (e). Black and red dotted lines show the thresholds for positive detection (mean value of all signals plus one standard deviation) in case of the conventional and LNC-3-based signals, respectively. Reproducibility of the ABR detection of E. faecium with the LNC-3 technique (f). Sensitivity analysis: Different amounts of target DNA were applied to the LNC-3-functionalised microarrays. 10 ng DNA corresponds to 106 bacterial cells (g).

