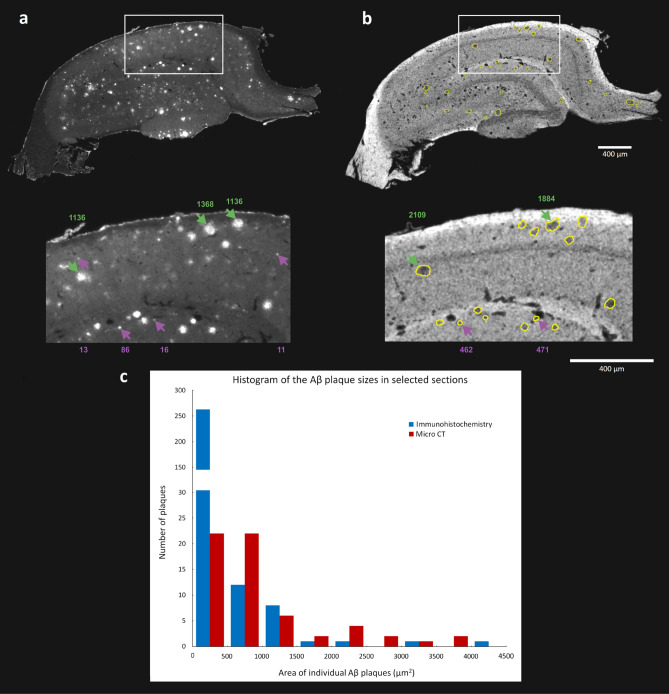
Figure 3.
Comparison of the precision in identification of plaques in micro CT data versus the immunohistological detection: Comparison of corresponding sections from the same rat brain showing immunodetected Aβ plaques (a) and the micro CT data where the yellow line represents the manually selected plaque boundaries (b). The purple arrows indicate examples of the plaque cross sections corresponding to the smallest fraction (0–500 µm2) while the green arrows mark the larger size cases. The corresponding area values in µm2 are reported in proper colors above and under both pictures. The histogram (c) depicts the size interval distribution of detected Aβ plaque sections in the selected slices using immunohistochemistry and micro CT imaging, respectively41–43.

