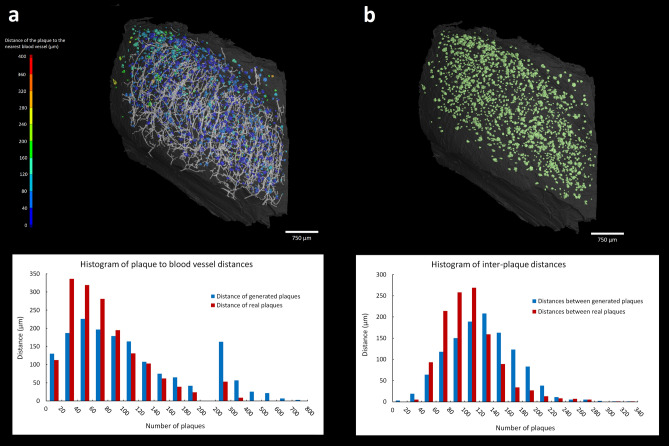
Figure 5.
3D quantitative analysis of the plaques distribution in hippocampus: Horizontal view of the hippocampus with color coded distances of individual plaques to the nearest blood vessel (a) and the corresponding histogram showing the distances to the nearest blood vessel of randomly generated (in blue) and the real (in red) plaques, respectively. Horizontal view of the hippocampus depicting the distribution of the plaques inside the hippocampus (b) and the corresponding histogram showing the distribution of randomly generated plaques (in blue), and the distribution of real plaques (in red)41,42.

