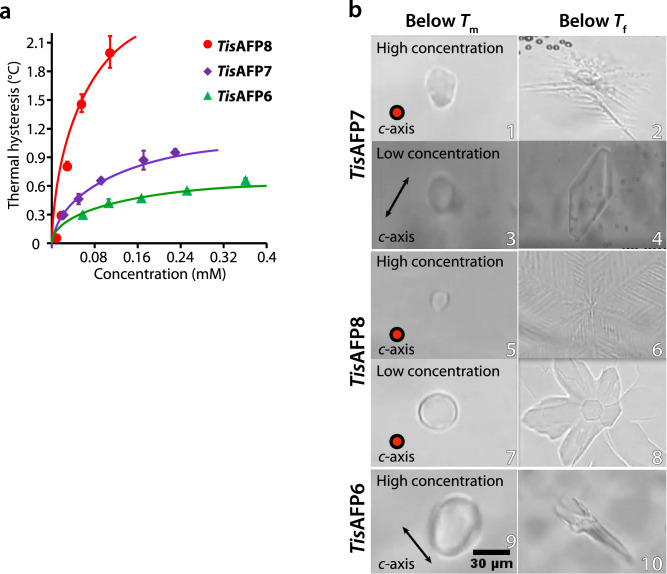
Figure 1.
Comparison of the antifreeze properties of TisAFP7 and two other TisAFP isoforms, the moderately active TisAFP6 and hyperactive TisAFP8. (a) Plot of thermal hysteresis values for the three isoforms at various protein concentrations. Purple, TisAFP7; red, TisAFP8; and green, TisAFP6. The values are means and the error bars are standard deviations from three independent observations at each protein concentration. The values for TisAFP8 and TisAFP6 are adopted from reference22. The curves were fitted for ease of interpretation. (b) Microscopic images of ice crystal morphology in solution of AFP isoforms at melting (Tm) and non-equilibrium freezing temperature (Tf). High and low concentrations denote 0.23 mM and 0.01 mM for TisAFP7; and 0.12 mM and 0.01 mM for TisAFP8. For TisAFP6, ice crystals grown at 0.1 mM are shown. The c-axis direction of the ice crystal is shown in the figure as a circle or an arrow. The images are representative of three observations under each condition.

