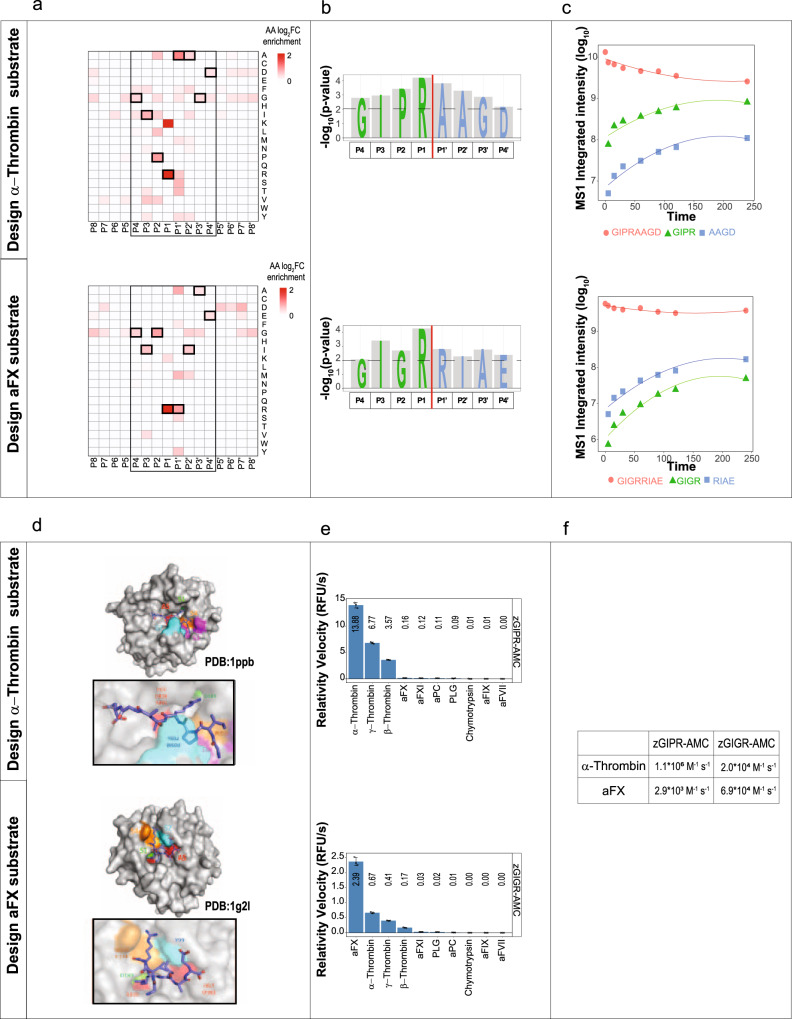
Fig. 5. Design of octapeptides and fluorescent substrates.
a Determination of best-matched substrates from the positional amino acid preferences using positional substrate preferences (log2FC enrichment compared to random distribution). The best-matched positions selected for the substrate design are highlighted in bold squares. b Representation of -log10 p-values of AA selected for the octapeptide design to assay protease activity of α-Thrombin and aFX. c The MS1 intensity integrated area for targeted octapeptide substrates and the corresponding cleavage fragments after incubation with activated α-Thrombin and aFX over time (0–240 min). d In silico docking of activated α-Thrombin and aFX with the two model octapeptides obtained by HPEPDOCK software. The docked peptides are shown in stick mode and proteases (α-Thrombin 1ppb; aFX 1g2l) in surface representation. The location of active site (AS) and specific active pocket sites (S1–S4) are indicated in different colors (green, orange, red and purple). e Determination of substrate selectivity measured by the relative reaction velocities (RFU/s) of fluorescent substrate processing for activated α-Thrombin and aFX tested with a panel of closely related coagulation proteases (n = 3 independent replicates). Data are presented as mean values±SD. f The calculated kcat/KM values (M−1s−1) for activated α Thrombin and aFX. Source data are provided as a Source Data file.

