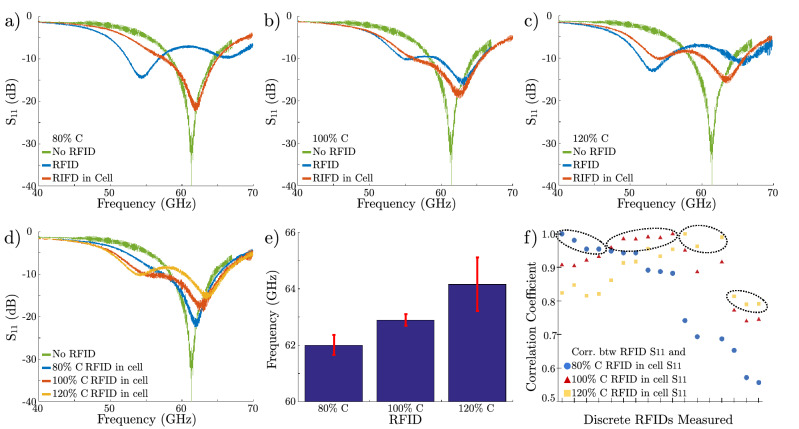
Figure 5.
(a–c) Electrical response of the standalone transceiver (green) and the three different classes of RFIDs (80%C, 100%C, and 120%C) stored in isopropyl alcohol (blue) and 24 h after completing the uptake process (red). (d) A direct comparison of the electrical responses of the three batches of intracellular RFIDs 24 h after completing the uptake process. The different devices show different electrical signatures with different resonant frequencies. (e) Mean and standard deviation of the resonant frequency of a sample of 5 devices for each capacitor value RFID. (f) Given a mixed batch of RFIDs with all three types of devices, individual RFIDs can be categorized according to the correlation match between the response and the expected RFID responses. The x-axis designates individual RFID measurements and the y-axis represents the correlation coefficient calculated from the measurements. Note that high correlation (circled) indicates the measured RFID’s most probable capacitance and corresponding design, enabling us to identify individual RFID tags.

