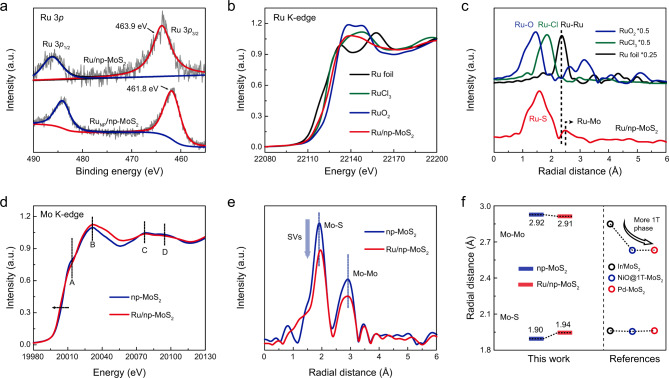
Fig. 3. X-ray absorption analyses of Ru/np-MoS2.
a Ru 3p XPS spectra of Ru/np-MoS2 and RuNP/np-MoS2. b Ru K-edge XANES spectra of Ru/np-MoS2, RuO2, RuCl3, and Ru foil. c Corresponding FT-EXAFS spectra from (b). d Mo K-edge XANES spectra of np-MoS2 and Ru/np-MoS2. e Corresponding FT-EXAFS spectra from (d). f Comparison of the radial distance of the Mo–S shell and the Mo–Mo shell for np-MoS2 and Ru/np-MoS2 with reported MoS2-based SACs.

