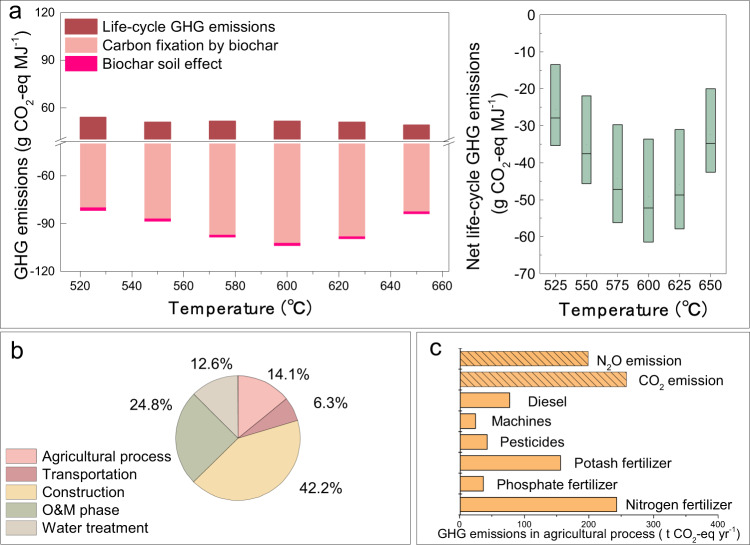
Fig. 3. The GHG emissions for a demonstration BIPP system with biochar sequestration (excluding fossil fuel offset).
a Left figure presents life-cycle GHG emissions, carbon fixation by sequestering biochar into soil (influenced by the stability of biochar), and reduced emissions by biochar soil effect (explained in “Methods”), while the right figure represents the net life-cycle GHG emissions for the whole system; b the GHG emission shares of five subsystems at 600 °C with the lowest net life-cycle GHG emissions; c the GHG emissions for different components of agricultural production (with N2O and CO2 emissions coming from soil as explained in Supplementary Note 13).

