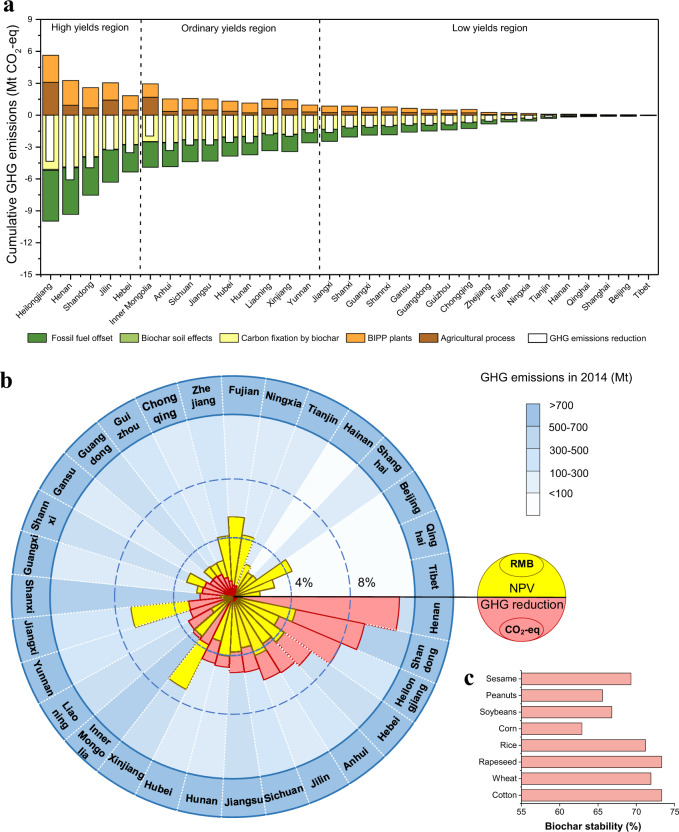
Fig. 4. Spatial distribution of GHG emissions reduction and economic feasibility of national deployment of BIPP systems.
a Comparison of GHG emissions reductions across Chinese provinces with deployment of BIPP systems (note that provinces are ordered by the amount of available crop residues); b overlapping graph of shares (%) of national GHG emissions reduction per year (red sectors) that could be achieved in Chinese provinces using BIPP systems with biochar sequestration (omitting Taiwan, Macao, and Hong Kong), and shares (%) of national NPV economic performance (yellow sectors); the blue background shades indicate total GHG emissions levels in 201432, as defined at right; c the stability of biochar produced from various crop residues of a BIPP system at 600 °C.

