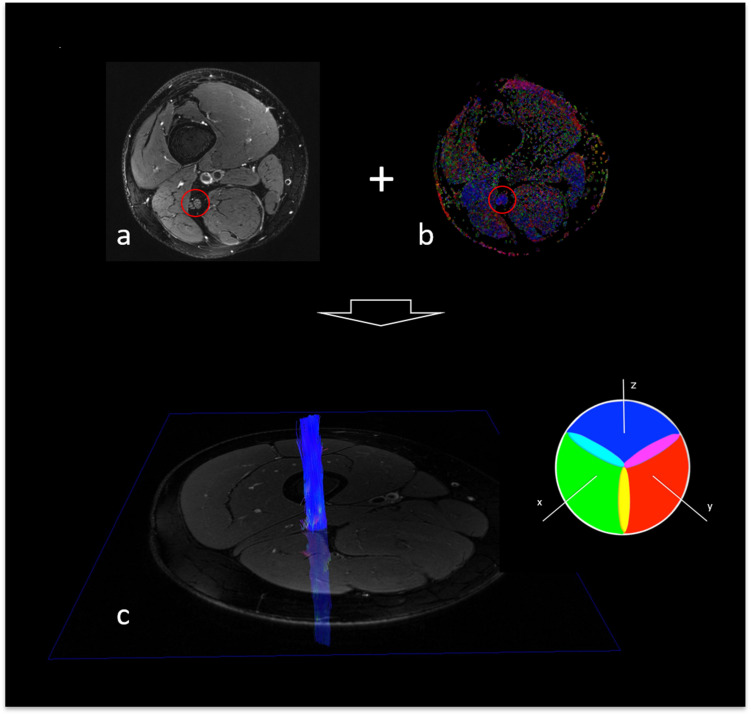
FIGURE 2.
Fiber tracking of the sciatic nerve. (a) T2-weighted, fat suppressed image of the right thigh, depicting the sciatic nerve (red circle). (b) Colored map of fractional anisotropy (sciatic nerve encirceled in red). (c) Reconstructed, 3-dimensional fiber track of the right sciatic nerve with color encoding according to the DTI eigenvector color map where voxel color reflects the direction of the diffusion tensor in that voxel. Color intensity is scaled with the FA.

