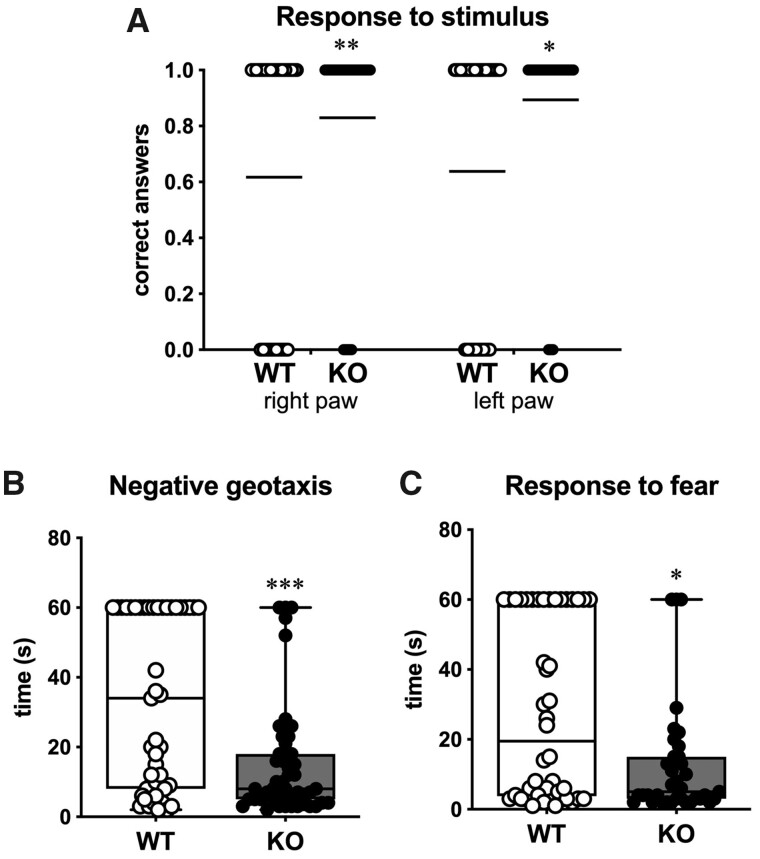
Figure 1.
Behavioural testing on pups. (A) Response to stimulus. Scatter dot plot of all responses. Shown are the correct (1) or wrong (0) responses following a stimulus to the right and left anterior paw of WT (open circles) and of the SESN3-KO rats (solid circles) (n = 46 rats). Horizontal lines indicate the percentage of correct responses. Statistical analysis: Mann–Whitney U-test. (B) Negative geotaxis test. Time spent by WT and SESN3-KO rats to turn from down to up on the 45° inclined plan (n = 46 rats). (C) Response to fear. Time spent by WT and SESN3-KO rats to turn from the edge to the centre of the plan (n = 46 rats). Statistical analysis in B and C: unpaired t-test with Welch’s correction. *P < 0.05; **P < 0.01; ***P < 0.001.

