Figure 7.
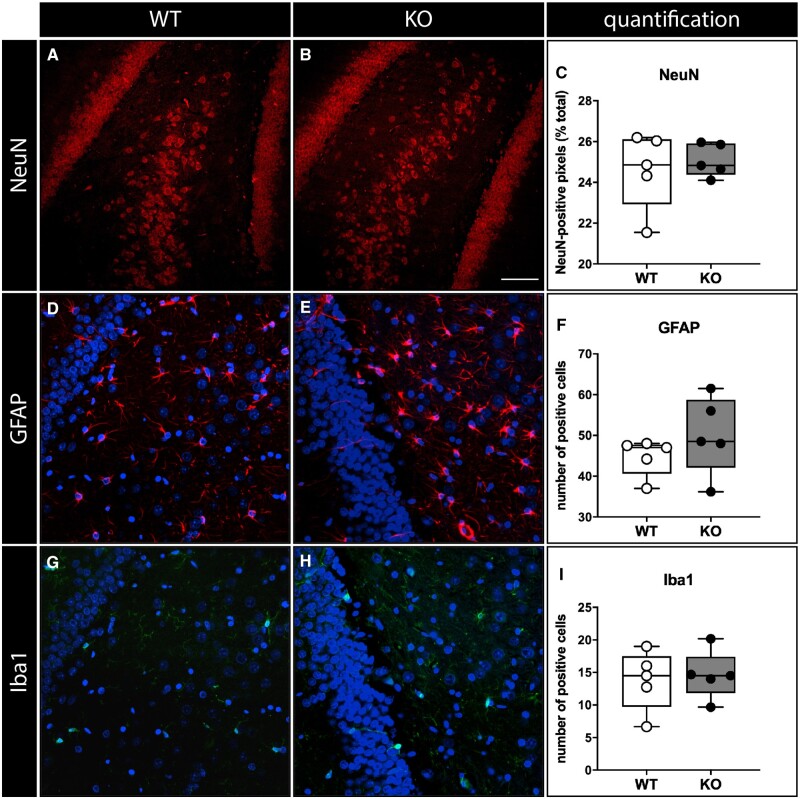
Immunohistochemical analysis. Neurons (A–C), labelled in red with a NeuN antibody, astrocytes (D–F, labelled in red with a GFAP antibody), microglial cells (G–I, labelled in green with an Iba-1 antibody). Shown are representative sections of the dentate gyrus area from naïve WT (A, D, G) and SESN3-KO rats (B, E, H). DAPI staining in blue. Data quantification in C, F, I. In all panels, open circles represent WT and solid circles represent SESN3-KO rats. Horizontal bar in panel B (for all panels) = 100 µm.

